Like IBDelphi Trio, IBDelphi
Quartet was developed to more accurately calculate the chance that both
members of a consanguineous couple are carriers of a unmapped recessive
autosomal disease which is known to occur in the family. However, rather than
comparing the haplotypes of autozygous regions in an affected individual to the
haplotypes of IBD regions in the couples, IBDelphi Quartet
compares the haplotypes of IBD regions in the couple to the haplotypes
of the IBD regions in a related consanguineous couple who have had an affected child.
IBDelphi Quartet then identifies what proportion of the
couples IBD regions are also IBD for the same haplotype in the parents of the affected
child. Consequently, IBDelphi Quartet assumes that the
disease gene is located in an extended IBD region in both the couple and the parents
of the affected relative.
Data analysis
Analysing the data files
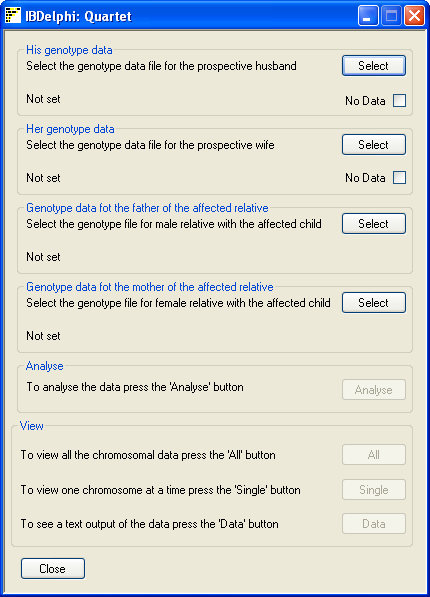
Figure 1
Genotype data files for each of the individuals in the analysis are added by
pressing the appropriate Select button in the upper
panels of the main form. When these files have been entered, the
Analyze button in the Analyse panel of the main form becomes active.
Pressing the Analyse button prompts the user to
choose which set of positional data to use. Only the positional data in the
couples male's genotype data file is available. Once the distance units have
been selected the data is imported and analysed. First
IBDelphi Quartet creates the SNP database, loads the couple's genotype
data, followed by the genotype data for each of the parents of the affected child.
IBDelphi Quartet then scans the genotype data
for regions IBD and autozygosity. When complete the three buttons in the lower
panel become active (figure 2).
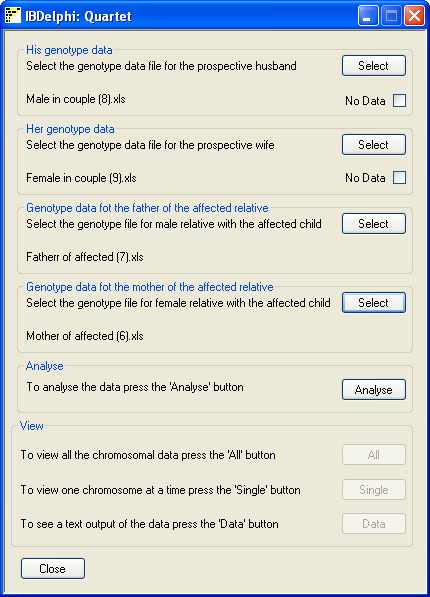
Figure 2
Viewing the results of the analysis
Viewing a summary of the analysis
To view a visual summary of the couples IBD regions with reference to those
those of the parents of the affected child, click the All
button in the lower panel. This opens a new window which displays the
results for all the chromosomes (Figure 3). The black, gray and yellow lines
represent SNPs that:
- Black: excludes the flanking sequences from having IBD in the couple.
- Grey: excludes the flanking sequences from having a common haplotye between
the couple and affected relative's parents
- Yellow: Do not exclude IBD.
Consequently, regions of possible IBD appear as blocks of yellow with the
occasional black or grey line which suggests a miscalled SNP genotype. Non-IBD
regions appear as a combination of black, gray and yellow lines, while white
areas show regions with no SNP coverage. Each chromosome may be flanked by blue
and red lines, these represents autozygous regions in the male (blue lines) and
female (red lines) genomes. The red and blue lines above the chromosome represent
the autozygous regions in the coupe, while those below the chromosome represent
homozygous regions in the parents of the affected child. This image can be saved
by pressing the Save in the lower left corner of the
window.
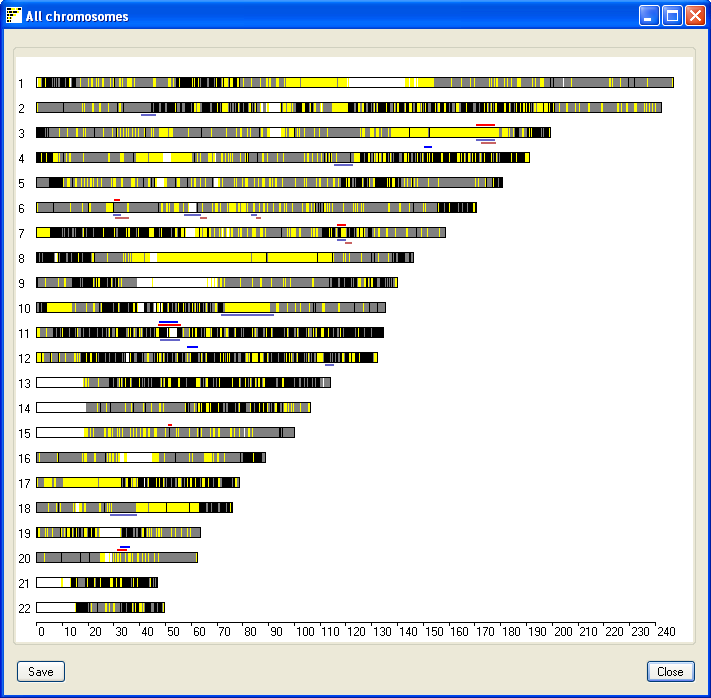
Figure 3
Viewing a detailed display of IBD regions on each chromosome
The IBD and autozygosity data for each chromosome can be viewed by pressing
the Single button; this opens a new window that
displays the results for a single chromosome (Figure 4). The current chromosome
is identified in the windows title bar and is selected using the drop down list
in the lower left hand corner of the window. As in the previous window possible
IBD regions are identified by an extended region of yellow lines with few, if
any, black or grey vertical lines. Each vertical yellow line shows the position
of a non-excluding SNP, where as vertical black lines identify SNPs that exclude
possible IBD between the couple's genomes and grey lines exclude a common haplotype
that is IBD in the parents of the affected relative and the couple. If either of
the idividuals contain extended regions of homozygosity they are shown as blue
(male genome) or red (female genome) rectangles flanking the chromosome. As in the
previous window the couples homozygous regions are shown above the chromosome and
the homozygous regions in the parents of the affected child are shown below the
chromosome.
Since it is assumed that the affected childs parents are consanguineous, the
disease is likely to be a caused by an autosomal recessive mutation located in
one of IBD regions of the parents. Similarly, it is unlikely to be located in an
autozygous region of one of individuals in the analysis. Consequently,
only regions that have a common haplotype in the both the couples and affected childs
parents genomes, but not autozygous in any individuals genomes are regarded as important.
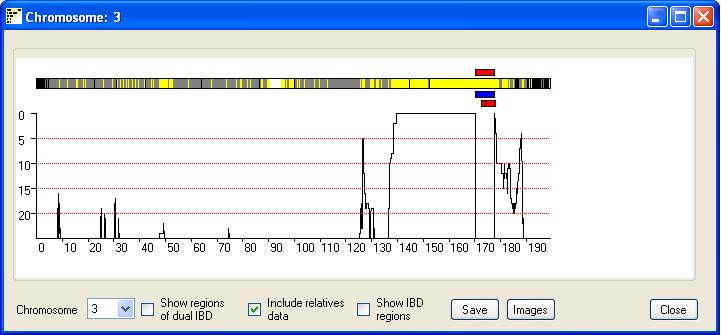
Figure 4
The default view of this window highlights regions that have a common
haplotype in the couple and affected childs parents. Unticking the
Include relatives data check box highlights all the
regions that show IBD in the couples genomes irrespective of the affected parents
haplotype status, this creates a view very similarly to IBDelphi (figure 5).
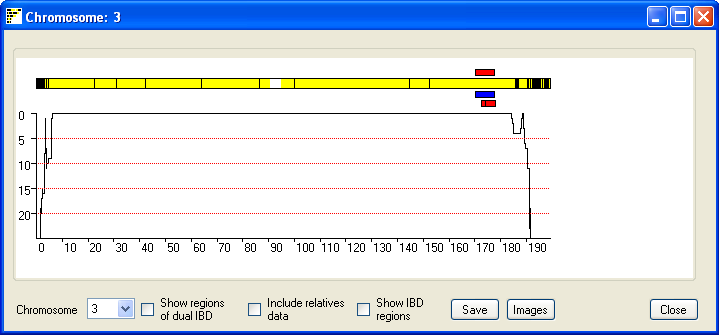
Figure 5
In consanguineous couples from outbreed populations it is unlikely IBD
regions will occur on both copies of a chromosome pair. However in couples from
an inbreed population it is possible for a region to have IBD from two distinct
common ancestors. Ticking the Show regions of possible dual
IBD check box displays a second chromosome in which extended regions of
yellow suggest both chromosome copies show IBD (Figure 6).
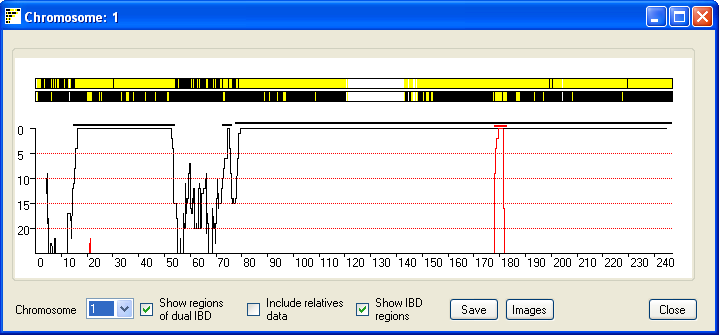
Figure 6
Due to the limited screen resolution, compared to the large number of SNPs
per chromosome, multiple SNPs are likely to occupy the same pixel on the screen.
It is consequently difficult to discern whether a region has been excluded by
just a few or by many SNPs. To give an indication of the number of SNPs that
exclude a region, the window also shows a graph of the number of non-excluding
SNPs in a sliding SNP window of 900 SNPs. Since most SNPs are uninformative, the
graph only shows regions that have 25 or fewer excluding SNPs. If the Show regions of possible dual IBD check box is ticked the
graph also shows a red curve which indicates the number of SNPs that exclude a
regions from been a region of dual IBD (Figure 6). Since the graph shows the
score across the sliding window of 900 SNP, the IBD region may project either
side of the region indicated by the graph. Ticking the Show
IBD regions check box highlights the true extent of the predicted IBD and
predicted dual IBD regions as a thick black and red line.
It is possible to save this window as an image file by pressing the Save button. Clicking the Images
button creates a web page that contains images of possible IBD regions of
interest on all the autosomal chromosomes, an example web page can be seen here. The
format of each image depends on the options chosen using the check boxes at the
bottom of the window.
Viewing a text summary of the possible IBD regions in a couple
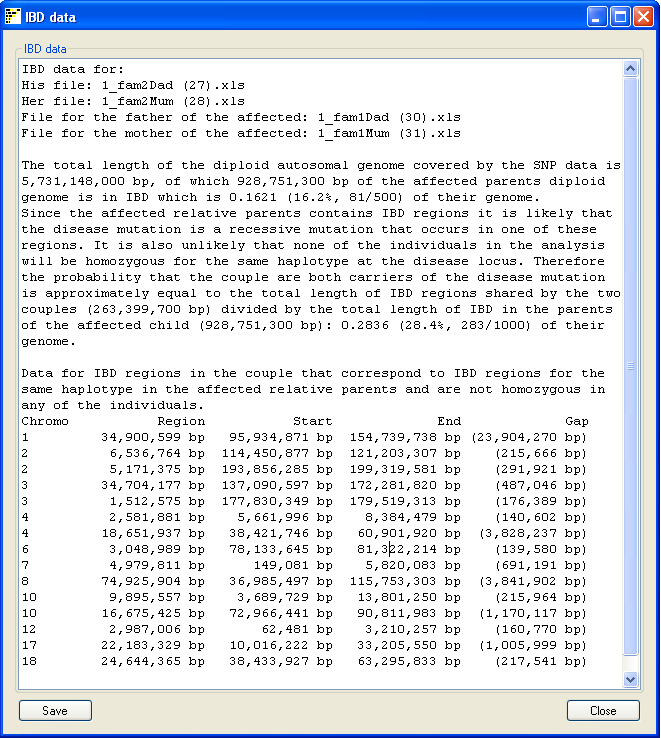
Figure 7
Pressing the Data button on the main window opens a
new window which summarizes the analysis (Figure 7). The summary includes the
name of the SNP genotype data files used and the size of the autosomal genome
covered by the SNP data. This value does not include the sex chromosomes or the
regions with no SNP coverage in the data file such as the P arm of chromosomes
13, 14, 15, 21 and 22. The total length of IBD regions found in the couple is
stated as both a physical size and as a proportion of the autosomal genome.
Since the disease mutation in the affected relative is probably in a region
that is IBD in its parents, the risk of both of the members of the couple been
a carrier of the disease allele is given as the proportion of the total length
of IBD regions in the couple that have the same haplotype as regions of IBD in
the parents of the affected child, compared to the total length of IBD regions
in the parents of the affected relative.
Finally, each region found is annotated with the chromosome it is on, its
size, start and end points and the total size of any gaps found in the region.
The gap size is important in IBD fragments that span regions of very low SNP
coverage, such as the regions flanking the centromere on chromosomes 1 and 9.
These gaps are automatically removed from the total size of IBD regions found.
This text can be either copied and pasted to a new document or saved as a text
file by clicking the Save in the lower left corner of
the form.