IBDelphi Duo was developed to more accurately calculate the
chance that both members of a consanguineous couple are carriers for an unknown recessive
autosomal disease. While it is possible to determine this probability based on the pedigree
structure, due to the manner in which chromosomes are inherited this figure could significantly
over or under estimate its real value. IBDelphi Duo works by analysing
the genotype data for the consanguineous couple to find regions that may be IBD by identifying
regions that lack SNPs that exclude its possibility.
Computer equirements
Data analysis
Analysing the couples data files
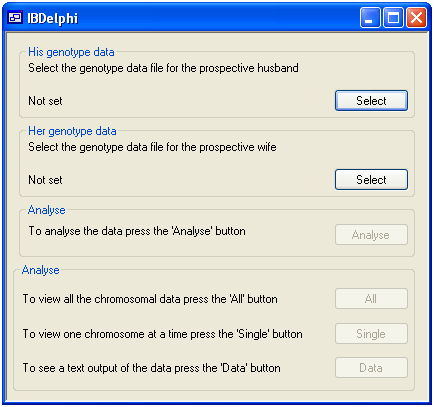
Figure 1
A genotype data file for each member of the couple is added by pressing the appropriate
Select button in the upper panel of the main form. When two
files have been selected, the Analyze button becomes active.
To analyse the SNP genotype data, click the Analyse in the middle
panel of the main form and choose the unit of distance you wish to use. Only distance
units present in the males data file can be selected. IBDelphi Duo
then creates the SNP database, loads the couples genotype data and then analyses the data.
When complete the three buttons in the lower panel become active.
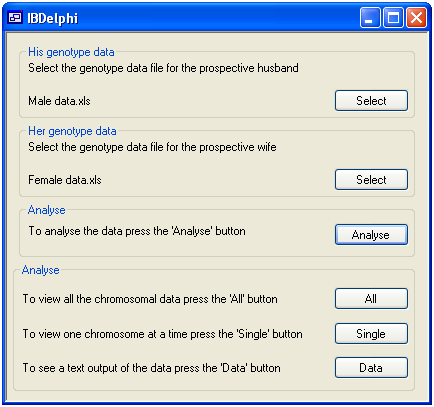
Figure 2
Viewing the analysis results
Viewing a summary of the analysis
To view a visual summary of the couples IBD regions, click the All button in the lower panel.
This opens a new window which displays the results for all the chromosomes (Figure 3). The black lines represent
SNPs that exclude the flanking sequences from having IBD in the couple, while
the yellow lines highlight SNPs that do not exclude IBD. Consequently, regions of possible IBD appear as blocks of
yellow with the occasional black line which suggests a misscalled SNP genotype. Non-IBD regions appear as a
combination of yellow and black lines, while white areas show regions with no SNP coverage. Each chromosome may be
flanked by blue and red lines, these represents autozygous regions in the male (blue lines) and female (red lines)
genomes. This image can be saved by pressing the Save in the lower left corner of the window.
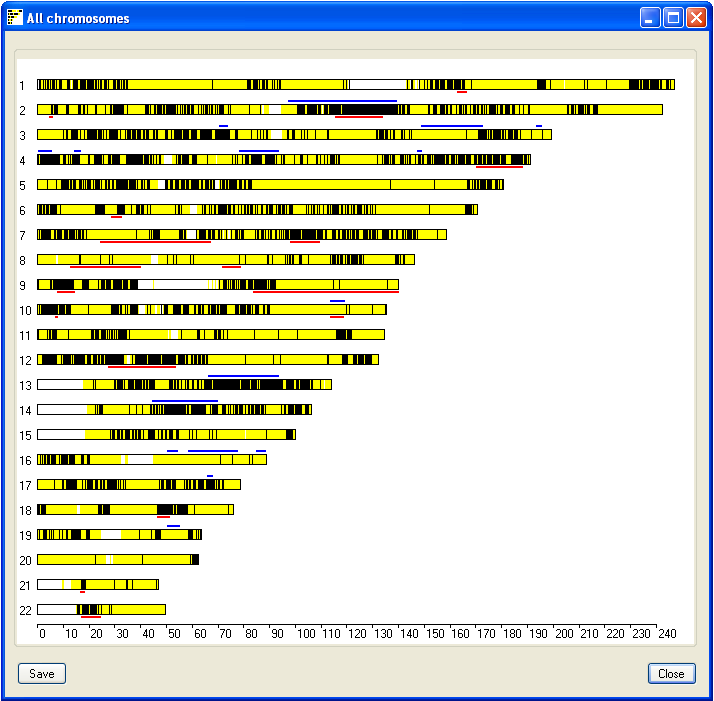
Figure 3
Viewing a detailed display of IBD regions on each chromosome
The IBD regions on each chromosome can be viewed by pressing the Single button; this
opens a new window that displays the results for a single chromosome (Figure 4). The current chromosome is identified
in the windows title bar and is selected using the drop down list in the lower left hand corner of the window.
As in the previous window possible IBD regions are identified by an extended region of yellow lines with few if
any black vertical lines. Each vertical yellow line shows the position 'of non-excluding SNP, where as vertical
black lines identify SNPs that exclude possible IBD between the couple's genomes. If either the male or female contain
extended regions of homozygosity they are shown as blue (male genome) or red (female genome) rectangles flanking the
chromosome (figure 5). In consanguineous couples from outbreed populations it is unlikely IBD regions will occur on both copies
of a chromosome pair. However in couples from an inbreed population it is possible for a region to have IBD from two
distinct common ancestors. Ticking the Show regions of possible dual IBD check box displays
a second chromosome in which extended regions of yellow suggest both chromosome copies show IBD (Figure 6).
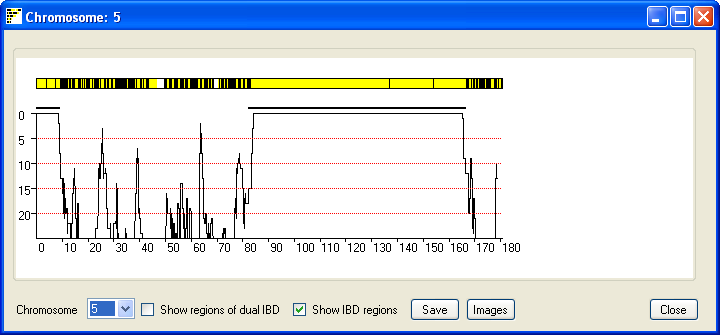
Figure 4
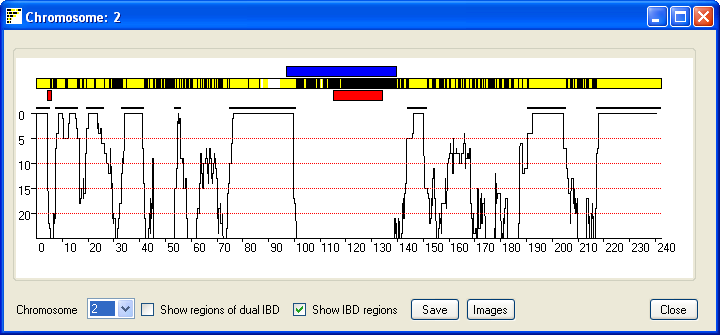
Figure 5
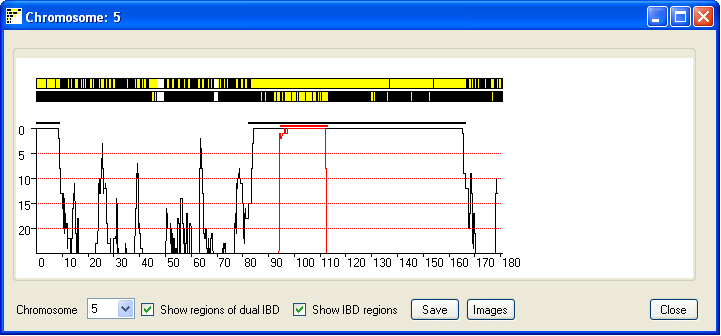
Figure 6
Due to the limited screen resolution, compared to the large number of SNPs per chromosome, multiple SNPs are
likely to occupy the same pixel on the screen. It is consequently difficult to discern whether a region has been
excluded by just a few or by many SNPs. To give an indication of the number of SNPs that exclude a region, the
window also shows a graph of the number of non-excluding SNPs in a sliding SNP window of 900 SNPs. Since most SNPs
are uninformative, the graph only shows regions that have 25 or fewer excluding SNPs. If the
Show regions of possible dual IBD check box is ticked the graph also shows a red curve which indicates the
number of SNPs that exclude a regions from been a region of dual IBD (Figure 6). Since the graph shows the score
across the sliding window of 900 SNP, the IBD region may project either side of the region indicated by the graph.
Ticking the Show IBD regions check box highlights the true extent of the predicted IBD
and predicted dual IBD regions as a thick black and red line.
It is possible to save this window as an image file by pressing the Save button.
Clicking the Images button creates a web page that contains images of possible IBD
regions on all the autosomal chromosomes, an example web page can be seen
here.
Viewing a text summary of the possible IBD regions in a couple
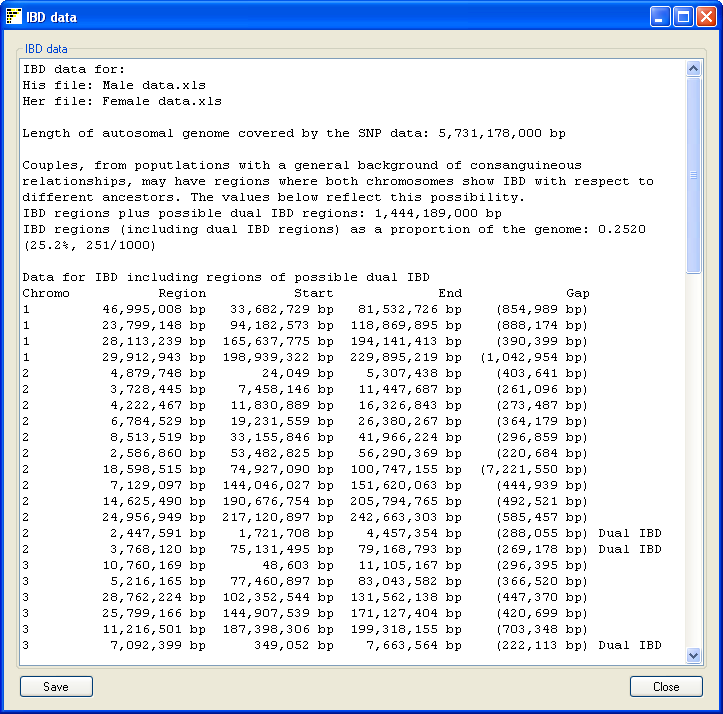
Figure 7
Pressing the Data on the main window opens a new form which summarizes the analysis
(Figure 7). The summary includes the name of the SNP genotype data files used and the size of the autosomal genome
covered by the SNP data. This values does not include the sex chromosomes or the regions with no SNP coverage in
the data file such as the P arm of chromosomes 13, 14, 15, 21 and 22. The total length of IBD regions found in the
couple is stated as both a physical size and as a proportion of the autosomal genome. Finally each region found is
annotated with the chromosome it's on, it's size, start and end points and the total size of any gaps found in the region. The gap
size is important in IBD fragments that span regions of very low SNP coverage, such as the regions flanking the
centromere on chromosomes 1 and 9. These gaps are automatically removed from the total size of IBD regions found.
This text can be either copied and pasted to a new document or saved as a text file by clicking the Save in the lower left corner of the form.